Friday, December 22, 2006

Barcelona, Montreal & Santa Barbara

So... this is it. My last day in the UK but definitely not my last post about the UK. Leaving this afternoon to Barcelona and will have quick pit stop by Montreal. The really exciting news is that I am moving to Santa Barbara at the beginning of next year. This will blog will continue to be linked with the Royal London Society for the Blind pretty much until I finish writing my dissertation. I will write more about Santa Barbara when I get a few minutes to sit down. Lately my life has been all about packing :)

Have a great break,

Vic

Wednesday, December 06, 2006

Website accessibility

I just read an article on the BBC noting that most websites (97%) do not comply with accessibility guidelines for the disabled. This was a survey of over 20 countries and the article notes that here in the UK only 3 websites achieved the minimum required standards. This is a truly scary statistic and a reflection of our ignorance when it comes to understanding disability. The main issues regarding web accessibility are:
  • The provision of adequate text description to accompany graphics (93% failed);
  • Over reliance on java script for functionality. Java script is particularly hard to handle if you are visually impaired and using speech software (73% of all websites surveyed relied on some form of java script);
  • Poor color contrast. Again this applies to the visually impaired population - individuals with are colour blind. It is important not only to differentiate between colours but also between tones (78% of sites surveyed had poor colour contrast);
  • Programing code used was below standard. Apparently 98% of sites were substandard. I have to admit I know very little about this and cannot comment on it;
  • Inability to alter or resize the page;
  • 89% of the sites were hard to navigate;
  • Excessive use of pop-up windows leading to problems with screen magnification software.

Click here to go to the article.

Tuesday, December 05, 2006

Psychosocial implications of blindness and low vision

“Any discussion of the psychosocial aspects of low vision must acknowledge the formidable task of defining the [blind and] partially sighted population…People with low vision are, without question, heterogeneous with regard to degree, type and amount of remaining vision… age, onset of the condition… educational status, receipt of various services; and adjustment or maladjustment to the condition.” - John L. Morse

Apart from the physical challenges imposed by their visual impairment, individuals who are blind or have low vision must also face the constant challenge of psychologically and socially adjusting to their disability. Tuttle (1987) defines adjustment as the process of responding to life’s demands and stresses. While there is no direct relationship between impairment and psychopathological disorders (Harrington & McDermott, 1993), the heterogeneous nature of conditions and the possible differences in family life, education, social and economic status suggest that adjustment is idiosyncratic – it is personalised, peculiar and dependent on the life experiences of the individual. The following paragraphs will present several psychosocial aspects of blindness and low vision. Following one of the key themes in this thesis it will argue that the education of both the self and society is essential for positive adjustment. It will expose some of the general misunderstandings about visual impairment and demonstrate how these are partly responsible for the perpetuation of myths and misconceptions regarding the character and abilities of this population. In direct relation to this thesis it will argue that confidence and self-esteem are deeply connected to the ability to navigate and wayfind and should be regarded as constructive elements of the ego and personality manifested in different types of introverted or extroverted behaviour. Wherever possible arguments will be backed by past and current research in socio and abnormal psychology as well as specific case studies recorded by the author during the years he lived and worked at the Royal London Society for the Blind as a life-skills tutor.

The age of onset blindness or impairment can have significant effects on the affective development of individuals (Rosa, 1993). During the years the author spent working as a life-skills teacher at the RLSB some students who were congenitally blind or visually impaired observed that they were actually happy by the fact that they were born with an impairment and not lost their vision later in life because they felt they were not missing anything as they had no idea what it actually meant to see. Jill a blind student went as far to remark that she preferred being blind than visually impaired. She felt that the total loss of a sense was more comforting than having “something that did not function properly.” The view that being congenitally impaired (usually congenitally blind) is easier to come to terms with is often mentioned in the literature (Morse, 1983; Warren, 1984) but should not be over generalized. Affective development is individual and context dependent. Clearly there will be differences in the adaptation of congenitally and adventitious blind or visually impaired. Time is an important variable to consider. First, a congenital impairment forces an almost automatic acceptance of the condition. An adventitious impairment on the other hand is often accompanied by an element of surprise, trauma and depression that requires a certain accommodation period. Trauma and depression can affect both the individual and the family at least an an initial shock. Training or experience should also be considered, as functional and positive self-development will depend on the individual’s mastery of the other senses and/or residual vision for the organization of information and active participation in society.

Social classifications

Man is a social being and a person’s sense of identity is dependent on the manner it is perceived by others. We adapt and live based on constant feedback from the family, community and friends. Feedback allows for the control and organization of actions and relationship to others and provides checks (approval or apprehension) on behaviour. The delivery of feedback is crucial and can have an important effect on one’s sense of identity, self-concept and esteem. Individuals who are blind or visually impaired must rely to a greater extent on auditory and tactile cues. While this type of information still allows for the discerning of moods, emotions and can help the individual make inferences about a person’s character and emotional state; it lacks the visual complement afforded by facial expressions. Morse (1983) observed that the blind are not very accurate at deducting and judging personal characteristics by voice alone. For this reason, communication must be clear, reliable and as redundant as possible to avoid mix-ups from both the sighted and the visually impaired.

In some individuals who are blind or have low vision the normal appearance of the eyes (and the individual in general) can lead to a certain amount of confusion and in some cases to general mistrust, suspicion or doubts about the degree of the impairment. Roger, one of the author’s most extreme cases lived through his early teen years under scorn, disrespect and was often taken for a lazy, unmotivated and careless man. In his early teens Roger complained to his mother that he could not see very well. Together they visited a series of ophthalmologists who failed to diagnose his condition, many of them saying that they could not find anything wrong with his sight. His performance at school declined and some of the teachers went as far as to say that Roger was lying about his vision to make up for his lack of interest in school activities and his low grades. In reality Roger could barely read from the blackboard. Roger was finally diagnosed with macular dystrophy but the absence of any blindisms, mannerisms and the fact the he was not required to use glasses perpetuated some of the prejudice from both his teachers and classmates. Roger went on to complete school and university with minimal assistance. He developed a series of techniques that in time included the use of low vision aids such CCTV and other type of magnification tools. He now has a successful post at the department of transport.

Roger’s story is both shocking and a true example his mother’s trust and indefatigable persistence believing in her son until his condition was diagnosed and cared for. It also a reflection of Roger’s own character – his courageous and hardworking nature. Despite his impairment and years of shunning, Roger never gave up on his education and eventually was able to secure a good working post. Stories such as this, are the exception rather than the rule. These days, ophthalmologists are quite efficient in detecting visual conditions and introducing technical aids. Nonetheless, low vision continues to be filled with contradictions. The fact that an individual is not wearing eyeglasses, carrying a symbol or white cane or the fact that the eye forms the outside appears to be unimpaired can lead to some terrible confusion. Society must be educated – wisdom elevates, ignorance kills.

The way we are perceived however only partly reflects who we are. As we have seen in the previous section there are a variety of impairments each limiting different aspects of vision. The word limiting should not be taken lightly. Limit is related to vision not to behaviour in general. Morse (1983) notes that loss to the lower half of the visual field usually implies difficulties in mobility but does not mean that the individual cannot watch television, do a crossword puzzle or work in front with a computer. Similarly, loss to the right field is associated with difficulties in reading (reading print in western countries requires a left to right eye scanning) but does not imply a lack of independence in terms of mobility or spatial awareness. Low vision manifests itself in contradictory behaviours. It is not uncommon to see the student with low vision who cannot read from a blackboard but is able to comfortably ride a bicycle or the individual who can watch television from a distance but continuously stumbles on a step or curve. This lack of understanding often balloons low vision to total vision loss or at least leads to assumptions about general ability disproportionably discrediting the individual. We must seek to understand these limits and resfrain from making false assumptions and generalizations that can have disabling effects on one’s self-conception. The same is the case for blindness where the uninformed assumes that either individuals who are blind have more acute senses or that because of their loss there are incapable to independently cope with life in society. It is important to note that there are several strategies used by educators and orientation and mobility specialist that can be used to compensate for low vision irrespective of the location or amount of the visual deficit.

The manner in which people are labelled and classified can have important implications for in their social and personal lives. At the heart of Durkheim’s sociology of knowledge (Durkheim & Mauss, 1963) is the notion that classification is social in origin and a categorization and extension of reality. Low vision has often been described as a neither fish nor fowl phenomenon. Visual loss is many times perceived as an all or nothing occurrence. For some reason, blindness seems like an easier concept to understand than low vision. We can close our eyes; walk about the room and to a certain extent place ourselves in a situation of total visual absence and some of the difficulties associated with it. It is much harder to conceive of a situation of partial visual loss – and even more so of the different conditions and types of visual loss. Blindness in this sense is understood and classified by contrast to seeing. Low vision on the other hand falls in a sort “grey” and uncertain area.

An incorrect classification imposes an inaccurate reality. Classifying a person with low vision as blind can have serious limiting effects as individuals become uncertain of the extent of their residual vision and overall abilities. Labelled as blind individuals can sometimes act as if they were blind and eventually begin to see themselves as blind. The inaccurate labelling of low vision can also lead to wrong decisions in the part of parents. Lack of knowledge regarding the condition can force parents of children with low vision to adopt educational strategies that do not take advantage of residual/functional vision. It can also lead to a type of over caring where the parent spoils the development of the child hampering his/her independence. Sometimes children are placed on specialist school solely based on their acuity level while their functional vision would still make them competent candidates for mainstream education.

Passing

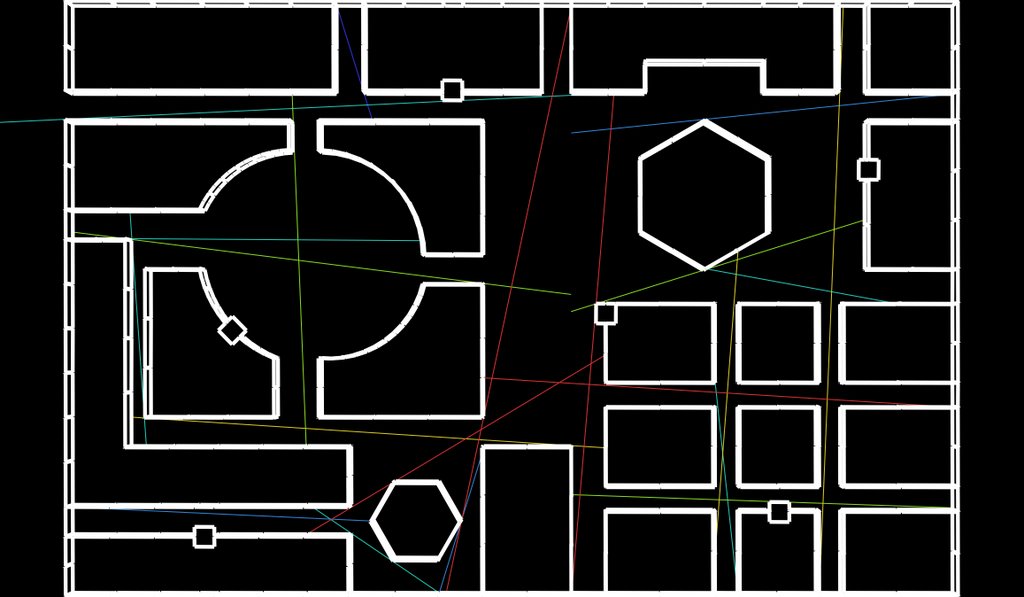
Passing occurs when an individual with low vision pretends to be blind or sighted in order to take advantage or cope with a situation. During his years at the RLSB the author had the opportunity to watch two cases of such theatrics whose relevance to this section make it worth reporting. The first case is that of Alex a teenager who enrolled with Dorton College as registered blind student. When asked about his visual condition Alex replied that he was blind and had no vision. He moved around with a white cane, used speech software in the computer and was learning Braille. He considered himself and was considered by others as a blind student. Alex was eventually asked to participate in the author’s study and was screened to be part of the blind group. During one of the tasks, when the subject is asked to construct a tactile model of the RSLB campus using scaled cardboard pieces, the author noticed that instead of asking for the pieces to be handed to him Alex was actually grabbing them from their location on the table. This behaviour was very odd considering it was impossible for Alex to reach directly with such dexterity.

Alex was not blind. After inspection of his personal file, the author discovered that he was diagnosed with Leber’s optic neuropathy (see section on eye conditions) when he was fifteen. Alex was passing as blind in order to claim a higher disability/incapacity living allowance. Free loading is not our primary concern especially if we consider that the actual claim difference is neither substantial nor extravagant. What is particularly upsetting is the fact that when passing as blind, Alex was educated as a blind person surrendering the functional aspect of his vision. Before the sudden onset of his condition Alex was a talented catoonist but passing as blind forced him to give up almost completely his sketching. Alex was not discarded from the research but re-classified as severely visually impaired (see chapter 7). He participated in both experiment and his overall high performance is further evidence of his ability to functionally use his residual vision. He is no longer viewed or considers himself a blind person and is currently working on strategies to make the best out of his residual vision.

The transition from education to the workforce is perhaps one of the biggest challenges faced by individuals who are blind or have low vision. That society discriminates should not come as a surprise especially in the labour market where the order of the day is the maximization of utility. Although the government intervenes and labour laws are constantly being updated, most recently laws on ageism; preconception, presuppositions, biases and prejudices still have their way in the work domain. It is in such situations that passing may be beneficial. David a former Dorton College student spent almost six months applying for a variety of jobs. The only replies came from fast food joints and cleaning services. David automatically turned these down. Taking a job means that he would have to give up his disability/incapacity allowance and as it turned out the wages offered were lower than what he was already receiving. Although the author does not condone this type of action, it is at least demonstrative of the difficulties in transition and to some extent the cult of poverty that many times surround disability.

David was upset. Not a single company, office or factory replied and he began to doubt his skills. At this moment he decided to pass as sighted. The author would be lying if he said that the situation really improved. What did happen was that David was at least able to secure two or three interviews, one of these with British Telecom (BT). Unfortunately, after passing most aptitude tests with BT and at the verge of being offered a job as a repairman, David was turned down because he did not have a driver’s licence. While it will never be known if passing is what secured his the interview it is at least clear from his experience with BT that as long as he was fully sighted he was able to secure a job. Presently David is working as cook at a school’s canteen. The irony lies that during his unemployed days the author hired David as his research assistant. He was trained, to interpret video data to enter it in Geographic Information Systems Software (ArcGIS) a somewhat advanced skill for a college graduate and something that would surely afford him a decent wage in the job market.

Psychosocial adjustment, self-concept identity & self-esteem

The overall psychosocial adjustment of individuals with disabilities has been a topic of much interest but of considerable disagreement. The adjustment to life in a world that is essentially visually biased is a complex feat and almost impossible to generalize. Adjustment is inevitably tied in with issues of independence, sufficiency and control and will vary from person to person influenced by their character, previous experiences and support network. Research on psychosocial adjustment has incorporated a variety of questions ranging from the impact of progressive or immediate visual loss, anxiety, the inability to work, avoidance and bullying to the role of support networks such as friends, families and charities. Morse (1983) reviewed several studies on the psychosocial adjustment of children with low vision. He concluded that children with low vision tend to be more unsettled by the limits of their vision, when compared to those whose handicaps are more severe and that their parents seem to be less understanding of the disability than those of blind children (Bateman, 1962). These results were echoed by Peadboy (1967) who found that children with low vision tend exhibit with more frequency underachieving like behaviours, fatigue and are more prone to emotional problems.

More recently a study by Kef (2002) on the psychosocial adjustment and the meaning of social support for Dutch teenagers (aged 14 to 24) with visual impairments revealed that majority of these teenagers had high-self-esteem, that they seemed to feel happy, not lonely and that most had accepted the implications of their impairment. No significant differences were found between blind and individuals with low vision (both severe and mild), although the scores for the severely visually impaired tended to be more negative. Interestingly, no significant differences were found between these groups and sighted adolescents. Sighted adolescents however, tended to have a larger network of family and friends although individuals who were blind or had low vision were satisfied and believed they received enough support from parents and peers.

An important aspect of psychosocial adjustment is the development of a positive self-concept. Self-concept can be defined as a set of attitudes individuals hold about themselves that help shape their identity, self-image, and esteem and what conditions their expectations and motivates their behaviour. It has important implications on the personal professional and social life of an individual. A positive self-concept is usually associated with the ability to cope and overcome the consequences of a disability. It gives an individual a positive outlook on life, satisfaction and commitment. Jake, another of the author’s student, was diagnosed at birth with retinopathy of prematurity and lost his sight when he was three years old. His parents were divorced, and he lived with his mother who happened to be unemployed and an alcoholic. It seemed as if Jake’s future was determined; his ability to flourish and overcome his disability hampered by his socioeconomic situation and his mother’s lackadaisical neglect. Fortunately the opposite occurred. Jake’s situation forced him to become independent at a very early age. The lack of support meant that he had to learn how to fend for himself and quickly develop life-skills to cope with life in a sighted world. With a remarkable hunger for achievement, and a constant strive for superiority Jake attended mainstream education and was able to properly function in society. As it turned out Jake was one of the best performers in the author’s experiment. His ability to represent space and ease of movement was a true reflection of his audacity and confidence. His mobility officer having once remarked that “watching Jake move is like watching poetry in the making.” Jake left the RLSB two years ago and now lives with his partner and future wife who happens to be sighted.

Individuals differ in how they accept their disability. In some cases, the inability to cope leaves the individual feeling detached from the general society. In other situations, individuals detach themselves because they feel they cannot fit in or are being pitied by others. Negative self-concepts are usually associated with isolation, depression and mental and health problems (López-Justicia, 2006). The author had the unfortunate experience of dealing with two separate cases of students whose emotional state was so low that they were contemplating suicide. Details are omitted in order to preserve teacher/student confidentiality. However, and without chancing any conclusion these individuals held several characteristics in common that were reflective of their negative self-concept. They were both blind from birth (retinopathy of prematurity), had few friends, preferred life at college than at home and tended to spend most of the time by themselves. They usually felt that they were not good enough and that the teachers and the “sighted society” communicated with them because they pitied them.

There is no general agreement as to whether the self-concept of individuals who are blind or have low vision differs from that of the sighted. Results from several studies summarized in Morse (1983) vary as to the positive and negative attitudes the blind and visually impaired children and teenagers have towards themselves. Jervis (1959) concluded that there were no significant differences between the blind and the sighted, while Meighan (1971) found that the blind tend to view themselves extremely negatively and Bauman (1964) that the partially sighted have a greater degree of anxiety, insecurity and loneliness. More recently, Sack (1996) found that individual with low vision perceive themselves more negative, expressing feelings of isolation and unjust fault when compared to the blind or sighted and Freeman et al., (1991) found that in many cases individual with low vision tend to reject services that would be beneficial because they did not want to be labelled as blind. Here it is worth noting that these all these experiments used different scales in their assessment of self-concept.

López-Justicia et al., (2001) conducted several studies to determine whether Spanish children and adolescents with congenital low vision had lower self-concepts than did their sighted peers. They found that children between 4-11 years of age with low vision tended to score lower on all dimensions of self-concept when compared to the sighted children. Interestingly differences were not significant in terms of family, physical appearance, self-worth, security and classroom. This lack of significance appears to be an indicator that these children are receiving and value the support from their family, classroom and peer networks. For children aged between 8-11 years significant differences with the sighted were found in regard to the relationship with classmates and relationship with parents. While the relationship with classmates was viewed as more negative (difficulty in making new friends or feel valued by their friends) the relationship with parents was regarded as strong and empowering. Finally, results for the adolescent (aged 12-17) group revealed significant difference with the sighted only in terms of physical self-concept with individuals with low vision scoring considerably lower than their sighted counterparts. These results are somewhat expected as it is during this age that individuals begin to pay more attention to their physical appearance.

Love is not blind, at least for most part of the time. Our exterior appearance and the body language that usually accompanies are responsible for many of the first impressions other have about us and unfortunately first impressions tend to last. It is not uncommon to find among blind and visually impaired teenagers those who think of themselves as unattractive, because of their weight or a physical deformity. The author was faced with many situations where he had to counsel many of his students regarding their exterior appearance in an effort to boost their self-esteem. Self-esteem is one of the key components of self-concept as it relates to the value that individuals place on their own characteristics, qualities, abilities and actions (Griffin-Shirley & Nes, 2005).

Here again, results from past research on the self-esteem of individual with low vision and blind are contradictory. In a longitudinal study , Shapiro et al., (2005) found significant gender differences on visually impaired children perception of competence. Males were found to be more positive at the beginning of summer camp when compared females. These difference however, tended to disappear across time with female competence levels increasing at the end of camp. The improvement in the perception of competence, for both males and females, across times emphasizes the role of friendship and participation in the development of a positive self-concept. That fact that these children were at a summer camp and constantly interacting with camp counsellors is further evidence that these individuals through their instruction verbal praise and ongoing feedback can function as guides and to some extent role models. Rosenblum (2000) found that although many teenagers had negative feelings about their visual impairment, the extent of this negativity varied among individuals with some deliberately hiding their visual impairment while other expressing unhappiness but understanding it as a part of life. Finally, a study by Huurre et al., (1999) on the social support and self-esteem among Finnish adolescents with visual impairments found similar results. In addition, Griffin-Shirley & Nes (2005) found no significant differences in the level of self-esteem and empathy between sighted and visually impaired preadolescents. These authors argue that the lack of difference may be related to recent trends in education and inclusion as well as greater awareness of the disability by the family. Sacks (1996) observers that in many cases low vision devices can be used to show an individual the extent of their functional vision and enhance self-esteem. He notes however, that these should be carefully instituted as they are highly conspicuous and may draw unnecessary attention to the individual.

Thursday, November 23, 2006

Kate's reply

I thought it would be a good idea to post Kate's reply to my pathetic attempt to answer her question. Also after reading her answer I became somewhat interested in the book by Pierre Villey "The World of the Blind" (Le Monde des Aveugles). Kate did mention however that the book is from the 30's and it might be a bit hard to find... Anyway here are her comments:

Hi Victor,

Thanks very much for your reply. The story re: the roller coaster was fascinating. Sorry about the length of the article--I know Byatt doesn't mention proprioception, although it seems that she does, without using the exact term. Anyways, your mentioning of Victor Hugo was extremely interesting--I recently read parts of Pierre Villey's "The World of the Blind," and he makes special reference to Hugo being popular with blind readers. (He suggests, however, that the "muscular images" that Hugo depicts--for example, the increasing/diminishing of the concrete space surrounding the reader--are especially evocative).

I think the "map or description capacity" is very interesting, especially in regards to spatial representation. I am looking at Milton's "Paradise Lost" (Milton had late-onset blindness) and he does create mapping (on a cosmic level) in his poem. I wonder, though, if mapping could take place within specific images. For example, the initial appearance of Satan in Paradise Lost seems to "map out" muscular movements (that the reader could proprioceptively sense or image, perhaps?):

Him the Almighty Power
Hurled headlong flaming from th’ ethereal sky
With hideous ruin and
combustion down
To bottomless perdition...
(I, 44-47)

To me this image is especially evocative in terms of the "muscular impression" it makes--especially by avoiding the visual--but I have full vision, and so am not sure.

Again, many thanks for your response!

Kate

Sunday, November 19, 2006

My reply to Kate - or at least an attempt at a reply...

Kate,

Apologies for the delay. The truth is I am really not sure how to answer your question. I finally managed to get my hands on the Byatt article (longer reading than I expected) and agree with the idea of imagery. In fact, I believe good poetry (and this is what a good friend told me last summer when I was writing) has the ability to place/situate the individual. The first lines of the poem are crucial in giving a sense of space- almost forcing the individual to imagine a location or a situation. Good writers can easily do this - I am currently reading "Les Miserables" and the courtroom scene when Jean Valjean admits his guilt is a perfect example. But we are not talking about imagery but proprioception and here I suspect it is more difficult – but not impossible.

Just to clear things up. I think proprioception should be interpreted at least in this case as some type of "muscle memory". When I first read your question, what immediately popped into my head is that dizzy, swinging or rocking feeling you can get when you go to bed after having spent the entire day at an amusement park riding the roller coasters. Although our vision does play a great part in giving that "strange" feeling in our stomach, I think it cannot be denied that the actual feeling is the result of a transition of states - by this I mean a movement (or constant movements) that we are and our bodies are not accustomed to and are capable of making an impression. Vision does play a role in this as we can see a changing state/perpsective and we can almost appreciate what is going to happen just by looking at the rollercoaster or any form of ride. Vision however is not necessary. Or to quote Susana Millar “vision is neither necessary nor sufficient.” Two years ago I happened to take some of my students to an amusement park in Brighton (nothing like La Ronde) and it did not surprise me at all that we all shared the same feelings when riding the rollercoaster. In fact my blind students probably felt more as there must be a certain amount of surprise and anticipation - something like riding a rollercoaster in the dark like in Disney.

Anyway... the fact that these individuals can appreciate these types of sensations and that these can be at least involuntarily evoked means that that some of these sensations are transferable. So now we get back to poetry. Are we able to transfer these sensations when reading a piece of poetry? I think that yes but it is not as simple as it is done with imagery. Here we are assuming that the congenitally blind are capable of imagery (something I really believe that is possible and think it is crucial to this argument). The reason I say that it is possible but not that simple is because I believe it to be a two-step process - at least when it is a voluntary experience. It requires individuals first to put themselves in the situation through the description and then if the placement is accurate enough, in the sense of evoking similar (not necessarily identical) muscle experiences, then the individual might feel something.

I think a better answer but one that does not necessarily apply to poetry but fiction is the map or location description capacity of some authors. This I think is a much simpler and better answer to your question.

Rafael Sabatini, Alexandre Dumas and to some extent Hugo were able to give very good descriptions of the streets of Paris, or the plantations in the Caribbean or whatever they wanted to describe. Hugo writes about the Architecture of the whole of Paris in “Notre Dame de Paris. In fact the whole book can be seen as a critique of architecture and some chapters are filled with details. Dumas did the same in his 3-musketeer saga. He depicts the streets of Paris in great detail (although sometimes he made some serious mistakes). In most cases these descriptions were narrated by the author both placing the and the hero individual directly in the setting. He describes for example when D’Artagnan walks from his house to the Louvre or Place de Greve or to the pub and these were accurate descriptions – map like descriptions. In this manner a proprioceptive transfer would consist of reading (and remembering these descriptions) and putting them to use when face or walking in these streets or having walked these streets (or circuit) in the past, feeling what the author is writing because of a prior experience that was registered through a type of muscle memory - here we assume that the person is blind and his/her recollection is purely based on movements that were once made.

I am not sure I am making much sense and I think that with the fear of over extrapolation I will stop here… Let me know if you think this is complete nonsense!

v.

Saturday, November 11, 2006

A reply to Kate from McGill University: A.S Byatt, proprioception, poetry and the blind

Last night Kate from McGill University left me this comment:

"Hi, I'm a student at McGill University, and wondered if proprioception could possible be evoked through poetry. A.S. Byatt published a paper in the TLS a month ago or so about mirror neurons being fired when reading certain works of poetry (she cited Donne). But perhaps the reader could also have a proprioceptive experience through reading poetry, particularly the blind? This may have gotten away from the main argument of your blog entry, but I would love to hear your thoughts. Thanks."

Kate, I'm not really a neuropsycholgist but the question really does interest me - at least in the sense of mental representation in the abscence of vision and proprioception. Give me a few days, I actually want to read what Byatt wrote (do you have the article?) and I'll see if I can come up with something coherent.

For now I found these two blogs that might interest you: So Many Books & Musings from Lehigh Valley

btw - I did my undergraduate at Concordia University :)

Have a good weekend,

v.

Thursday, October 26, 2006

Ecological perception: A few words on Gibson's theory and possible relation to visual impairment research

“… animal locomotion is not usually aimless but guided or controlled - by light if the animal can see, by sound if the animal can hear, and by odour if the animal can smell…The medium thus contains information about things… detecting this information, the animal guides and controls locomotion” – James J. Gibson

Whereas the representation and enrichment approaches drew heavily from the Cartesian dualist notion of perception and cognition (perception as a momentary stimulation of a set of sensory receptors separated from but complemented by a higher order cognitive processes), the ecological approach departs from an evolutionary perspective (Heft, 1997). For James J. Gibson, the father of ecological theory, the environment and the animal are inseparable - the existence of one implies the existence of the other. Mental processing and concepts of storage, enrichment and retrieval are replaced for relational and reciprocal links between the individual and the environment. The perceptual system has evolved in relation to the animal’s econiche and for this reason the study of human perception is relational and should begin with the environment and its reciprocity with the individual rather than how the individual perceives.

The ecological approach holds that perception is direct and present at birth. Perception is a bottom up process that depends on direct detection with no recourse to retinal, neural or mental pictures. That is, perception is not mediated by assumptions, preconceptions, expectations or mental images. Gibson believed that perception is designed for action. The process of information pickup “involves the exploratory activity of looking around, getting around and looking at things” (Gibson, 1986, pp. 147). Individuals perceive in order to operate in the environment and this perception is based on affordances or possibilities for action provided by the environment. The different sensory modalities are in themselves capable to pick up and make sense of change and invariance in the environment. Information is picked up through a process of resonance, similar to a radio, where individuals tune themselves to the environment. The process of storage and retrieval of information is erroneous since information is always available. To perceive is to be aware of the surfaces in the environment.

Affordances are picked up from the invariant characteristics of the environment and are detected depending on the perceiver’s species and current psychological state. They consign meaning to objects (Goldstein, 1981) and are directly perceivable. The concept of affordances is crucial to Gibson’s theory as it allows him to reject the more conventional notion that meaning is stored in long-term memory. Taking an evolutionary stand Gibson believed that a considerable amount of perceptual learning had already taken place throughout history making it not a necessity during a person’s lifetime. In proposing the notion of affordances Gibson shifts the focus to the environment by claiming that all that is needed to make sense of the environment is directly present (Eysenck & Keane, 1990). Learning consists of the improvement of perceiving and is mediated by practice and the education of attention not memory.

Gibson is said to have implemented the temporal element in perception (Eysenck & Keane, 2005). However, his focus was not on time per se but on cycles, sequences, events and changes. Events are the primary realities and time is filled with events. The bulk of Gibson’s theory can be said to revolve around the information acquired through persistence under change. In this sense, ecological perception focuses exclusively on the reciprocity of the concepts of variance and invariance - how information is picked up by the interplay of locomotion and the non-changes. It is worth noting that for the most part the theory is concerned with of optic flow information and the kinaesthetic quality of vision. Events cause “disturbances” in the invariant structure of the optical array (different types of events causing different types of disturbances). Goal-oriented locomotion depends on sequential optical array information and the reciprocal interplay between the variant and invariant structures of the environment. Locomotion is guided by locating the invariant features that specify a destination and by keeping focus of the optical outflow towards the destination.

The theory also accounts for the role of perceptual systems other than vision. The body in motion and proprioception are seen as important sources of stimulus information to vision and the other senses. Gibson criticized the Gestalt notion that the senses pick up individual information that is made to cohere during the process of perception. For Gibson, the senses were perceptual systems in themselves. Perceptual systems that are both propriosensitive and extereosensitive - self and environmental perception are complementary. Movement affords information about the environment and self that is multiple and concurrently gathered. The “individual not only sees himself, he hears his footsteps and his voice, he touches the floor…he feels his head turning, his muscles flexing, and his joints bending” (Gibson, 1986, pp. 115).

Gibson denied that wayfinding is mediated by a sequence of turning responses conditioned by stimuli (response chain theory) or by consulting an internal representation or map of the environment (cognitive mapping theory). He believes that the only appropriate way to understand wayfinding is through the theory of reversible occlusion. For this he introduces the concept of vistas and transitions. Vistas are defined as extended regions (semi-enclosures or a set of unhidden surfaces), a layout of environmental features presently visible, (Heft, 1996) that are serially connected, unique and reversible. Transitions are more salient and allude to parts of the path of travel where the individual can begin to capture the next vista. Moving from one place to another consist of “the opening up a of the vista ahead and closing in of the vista behind” (Gibson, 1986, 198). In this manner, to wayfind in an unknown environment consists of sequentially selecting from a choice of vistas, whose uniqueness can act as a landmark, presented by the environment. As follows place learning consists of learning the affordances of different places and learning how to distinguish among them.

In regards to this thesis, perhaps the most relevant feature of the theory is the notion perceptual information is primarily used in the organization action (Eysenck & Keane, 2005). Locomotion and manipulation are not triggered by stimuli outside the body or initiated by commands inside the brain but dependent on the active control of information and by seeing/perceiving oneself in the world. The individual is aware of the environment while actually moving through it. Although Gibson held that the control of information was predominantly visual he acknowledged that proper awareness could only be achieved through movement. To perceive “involves the coperceiving of the self “ (Gibson, 1986, pp. 240). The information for perception always comes in two – in relation to the environment and to the self. In this manner, exploration is assigned a crucial role in perception. Active (focus on active rather passive) exploration is required in order to separate invariants from variants and the eventual awareness of information. Exploration is what allows an observer to continuously learn about surfaces (their layout, substance, events and affordances) as perception itself becomes finer, richer and fuller as one explores (Mace, 2005).

In a series of experiments on the role of vistas and transitions in wayfinding, Heft (1983) was able to show that in route learning, transitions (or periods of saliency maximal change in the perspective structure) are more important than vistas. Participants who viewed a movie consisting only of continuous transitions in a particular route were particularly attuned in their detection and performed significantly better in route retracing exercise when compared to those who viewed a movie consisting only of vistas. This is of particular value for perception in the total or partial absence of vision for two reasons: First, transitions unlike vistas do not necessarily need to be visual. A transition can be a particular intersection in a street network that can be detected by a change in curvature orientation. Furthermore, the concept of successive transition implies some form of structure or hierarchy. Wayfinding is inevitably temporal and can be described as navigation within “a nested hierarchy that unfolds over time (Heft, 1996, pp. 122). Notice here that the basis of wayfinding is not a mental representation but the access or presence of sequential information.

It may seem strange to devote so much attention to Gibson’s theory considering it is almost entirely based on visual information. Nonetheless, the notion of action, locomotion and temporally structured navigation has important implications for wayfinding in the total or partial absence of vision as blind and visually impaired individuals are forced to move in order to perceive. It is the reciprocity of information and action that allows for the continuous updating and orientating necessary for accurate navigation. Instead of a succession of vistas (although navigation using continuous vistas is still plausible in the partial absence of vision) the blind or visually impaired individual can use a proprioceptive/environmental (action/perception) loop system based on transitions. With the risk of extrapolation, what we want extract from Gibson’s ecological theory is the inseparability of the individual and the environment and the active perception of reality through succession or successive situation transitions (Heft, 1996). The difference lies on the idea that information is controlled via proprioception and the operation of the other senses. This is in tune with the Gibsonian notion of perceptual systems where information is redundant and concurrently gathered. As we shall see on the following chapters much of Carreiras and Codina (1992) and Susanna Millar (1994) amodal theories of spatial coding are based on these assumptions.

The ecological approach differs substantially from the traditional approaches in that it rejects the notion of input processing in perception. Its relevance to perceptual psychology however, is undeniable. First, it allowed for a consideration of direct perception by showing that a considerable amount of information about the environment can be directly perceived. The approach also links perception to locomotion rather than the static viewing of stimuli, as it is through the moment-to-moment changes in the optic array that one makes sense of the world.

There are some limitations to this approach. First, while Gibson acknowledges that supplementary information about movement can be picked up by the haptic system he still held the extreme view that locomotion is strictly registered by vision in that the visual system yields the only reliable information regarding displacement (Gibson, 1986, pp. 126). As we shall see, there is a considerable amount of useful wayfinding information that can be assembled through muscle memory or proprioception. Second the theory has also been criticized by the manner in which he treats meaning in perception. Although Gibson went through great lengths in discussion of affordances it is hard to believe that stored knowledge in long-term memory does not play a role (even if minor) in recognition and perception. For an in depth criticism of Gibson’s representation free theory please refer Fodor & Pylyshyn (1981).

Gibson has also often been criticized by the lack of experimental evidence to support his theory. If fact most of the experiments reported in his work are his own. In addition, the actual design of experiments to study the role of invariants can be very complex and have only recently been taken up by researchers (Goldstein, 1981). Finally, perhaps the biggest flaw is Gibson theory is the ineffective almost nonchalant manner in which he deals with the acquisition of configurational or global knowledge of an environment. He believed that the control and organization of vistas through exploratory locomotion would eventually lead for the whole of the habitat to be apprehended. This “complete” apprehension was equivalent not necessarily to a bird’s eye view of the environment but to being everywhere at once. As we have already seen and as it will be continually argued, it seems hard to deny, irrespective to which representational or constructivist theory we adhere to, that at least some part of the formation of configurational knowledge depends on cognitive processes that make sense of discontinuous perceptual encounters.

Saturday, October 21, 2006

CASA 4 Cancer Research

So...after very little training we have decided to organise a team to represent CASA for a 10k run for cancer research UK. if you would like to sponsor the team you can donate over the internet by clicking here.

The team will consist Kay Kitazawa, Joel Dearden, Maurizio Gibin and myself. The event will take place on the 29th of Ocotber at Dorney Lake and all are welcome to come and cheer! In fact, we need all possible cheering and encouragement. For further details on the actual venue click here.

Sunday, October 01, 2006

Spatial Cognition 2006 (Bremen, Germany)

Click to download my paper and presentation at the Spatial Cogntion conference last week in Bremen, Germany. The title of the paper is "Beyond statistical testing: Individual differences and the content and accuracy of mental representations of space".

Apart from the good quality of papers, thank you all (Irene, David, Ana, Renato, Cristophe, Samvith, Magda, Rodrigo, Alasdair, Rob, Stephan) for the entertaining after conference hours.

- God I wish I wish I was still on that boat...

RLSB sketch

Playing around with SketchUp software in the final design of the RLSB campus

Wednesday, August 30, 2006

Spatial Cogntion 2006


Conference is taking place from the 24 to the 28 of September 2006. Click here for more details.

I will be presenting at the "spatial learning and individual differences" workshop.

Title of paper: Beyond statistical testing: Individual differences and the content and accuracy of mental representations of space. I will post the paper and powerpoint in this blog as soon as I get permission from the conference.

Thursday, August 10, 2006

I never thought I would be doing this...

I'm still working on this post so it will take a few days. Anyway, here it is:

A repeated measures ANOVA was used to analyze the data from the pointing and the distance estimation taks. For the pointing task (figure 1)


Saturday, August 05, 2006

Tuesday, August 01, 2006

Saturday, April 22, 2006

Maze tracking

This is just a small example and it is unfortunate that the quality of the video is quite low and the change in colour between the different sections of the exploration cannot be clearly seen. I wanted a small file for now and I am still trying to figure out what is the best compression method. If you right click on the actual movie and select "full screen" you will be able to get a better image and differentiate between the various sections of the track.

The animation`was created with the tracking analyst extension in Arcmap. It shows the exploratory pattern of a visually impaired subject in the second experiment of my research. This subject's exploration lasted for 13:46 minutes (the animation takes 2 minutes) and it was broken up in seven different sections (the X in the animation indicate each section break). The idea is to comapre the strategy(s) used by the different subjects in each of these sections (and also for the whole exploration) and relate it to their performance in a series of spatial tasks.

I am still trying to isolate the possible wayfinding strategies that a subject may use during exploration. For the moment it is quite clear tha for the first two sections the subject in the video used a "perimeter" strategy and was able to locate the six different tables in the maze. During the 3rd and 4th section the subject retraced his steps along the perimeter making sure all tables were revisted. For the remaining time the subject used an "object to object" strategy between the tables in the southern part of the maze.


Powered by Castpost

Sunday, April 16, 2006

Found the quote!

...so for the past year I have been looking for the opening quote of my dissertation. I think I got it!!

"...on ne voit bien qu'avec le coeur. L'essentiel est invisible pour les yeux."

"...it is only with the heart that one can see rightly; what is essential is invisible to the eye."

-Antoine de Saint-Exupéry (Le Petit Prince)

Wednesday, April 12, 2006

Null hypothesis significance testing, individual differences and the ethics of visual impairment research

“Good research is difficult to do, but bad research is not worth doing at all” – David Warren


It is amazing that in the third year of my Ph.D. I find myself home on a Saturday evening (yes, I know what an exciting social life) writing about statistics. Yet, I have spent the past few days reviewing several articles in geography and psychology on the representation of space without vision that have relied on inferential statistics in the presentation and interpretation of results. These have not been pleasant days to say the least as some researchers continue to employ a variety of methods without a clear understanding of their purpose and meaning. More often than not, the probability values (p values) in null hypothesis significance testing (NHST) are misinterpreted which inevitably lead to false conclusions about the data. It was not long before I realised that a review of NHST was in order. During the past two decades, NHST has been under severe criticism. My goal is to present a brief review of this more than justified critique and discuss a variety of complimentary methods. This is by no means an in depth review and I suggest that anyone conducting this type analysis have a look at the list of books and articles below. While you are at the library it would probably not hurt to pop in the mathematics section and browse thorough John Tukey’s book Exploratory data analysis. As we shall see, the majority of the methods that should be used as either an alternative or complement to NHST are derived from Tukey’s work.

Chatfield, C. (1985). "The initial examination of data." Journal of the Royal Statistical Society. Series A (General) 148(3): 214-253.

Cohen, J. (1990). "Things I have learned (so far)." American Psychologist 45(12): 1304-1312.

Cohen, J. (1994). "The earth is round (p <.05)." American Psychologist 49(12): 997-1003.

Coe, R. (2000). What is an 'Effect Size'? University of Durham. 2000. http://www.cemcentre.org/ebeuk/research/effectsize/ESguide.htm

Kline, R. B. (2004). Beyond significance testing: Reforming data analysis methods in behavioral research. Washington, DC, American Psychological Association.

Schmidt, F. (1996). "Statistical significance testing and cumulative knowledge in psychology: Implications for training of researchers." Psychological Methods 1(2): 115-129.

Smith, F. A. and A. D. Prentice (1993). Exploratory data analysis. A handbook for data analysis in the behavioural sciences: Statistical issues. G. Keren and C. Lewis. Hillsdale, New Jersey, Lawrence Erlbaum Associates Publishers: 349-390.

Wainer, H. and D. Thissen (1993). Graphical data analysis. A handbook for data analysis in the behaviour sciences: Statistical issues. G. Keren and C. Lewis. Hillsdale, New Jersey, Lawrence Erlbaum Associates Publishers: 391-458.

Tukey, J. W. (1977). Exploratory data analysis. Reading, Mass.; Don Mills, Ont., Addison-Wesley Pub. Co.


So why am I doing this?

I would like to think that I am not stating the obvious but rather what should be obvious. When preparing this manuscript I could not help but wonder whether it really is a necessary part of my research. After all, a review of statistics seems like fairly basic material to cover in a doctorate thesis. It was not long before I discovered that many articles on blindness and visual impairment published in academic journals in geography and psychology have not taken into account some of the dangerous limitations of NHST and the noteworthy alternatives that have been proposed.

These disciplines have a long tradition of comparing between different groups of participants. Much of the research has focused on the way in which individuals within a group are similar to one another but different from other groups. In this case, comparing the abilities to mentally represent space of the sighted in relation to the visually impaired and blind. Conversely, very little attention has been paid to the ways in which individuals within a specific group differ from one another (Lewis & Collis, 1997). Comparing the abilities between individuals in different groups can provide important information on the role of vision in the representation of space and can assist in the formulation of theories on sensory substitution and proprioception. At times however, this method of comparison can be problematic especially when the adopted methodology does not allow for individuals in a specific group to fully express their abilities. This is often the case in experiments that compare the performance of blind and visually impaired subjects against a blindfolded control. In such cases the blindfolded control usually operates at a disadvantage as they are forced to rely in different strategies to problem solve. Similar problems occur in research that uses fully sighted controls. In many cases, the type and amount of information provided by the researcher for the completion of a specific spatial task tends to vary between groups. In this manner, Millar (1997; 2000) argues that performance is not based on actual spatial competencies but differences in the provision and access to the information that is necessary to complete the task. Finally, comparative approach does not offer the researcher any insight on the underlying processes that make up behaviour and influence these abilities.

The phenomenological world of the visually impaired is qualitatively different from that of the sighted (Rosa, 1993). If the two years I have spent working at the Royal London Society for the Blind have taught me anything is that individuals with visual impairments and blindness form part of a population that is extremely heterogeneous that many times cannot (and should not!) be classified in specific groups or categories. The tradition of making comparisons between groups assumes that individuals that make up a particular group share the same characteristics. In the majority of cases people with visual impairments are often grouped together because they have been diagnosed with the same eye or medical condition, share the same aetiology or because they have performed at a specific level in psychometric tests. Unfortunately, these types of classification are somewhat restrictive. Consider the case of individuals who are diagnosed with the closest matched condition. In such cases the expert does not know the exact nature of the impairment and bases his diagnostic on the present manifestation of symptoms and behaviours. Some of my students have been diagnosed with a specific condition (most of the time retinitis pigmentosa) although they do not exhibit many of the characteristics that the condition incurs. This type of unforced professional error cannot account for latent behaviours or symptoms and may cause a significant amount confusion if these individuals are mixed together in the same group. The fact the retinitis pigmentosa is a degenerative condition further complicates matters.

The lack of vision cannot fully account for the differences. Such strict causality is theoretically sterile (Warren, 1994) and does not recognize the growing amount of evidence on the spatial abilities of the blind and visually impaired. While the nature and history of the condition can have important implications for the development of spatial understanding concentrating on the pathology of the impairment is clearly not enough. The development of spatial abilities is also mediated through interaction and experience with the environment and culture. In this manner, while the group may be similar in either a medical, functional or clinical diagnosis (or any combination of these) is still not entirely homogenous. The comparative approach can be beneficial if the researcher is capable to control for a certain amount of cohesion within each specific group. This method is better suited when large and clear differences exist. However, when differences are slight or inexistent a differential or individual differences approach may be more suitable.

The individual differences approach accounts for the variety of effects that different factors and conditions have on the specific individual (Lewis, 1993). It focuses on two questions that cannot be fully explained by the comparative method. First, what is the nature of the variation? Second, what are the causes leading to such variation? Research on visual impairment and blindness is filled contradictions and it is not uncommon to find similar studies with conflicting results. In this manner, the first and a crucial step of this approach is to provide a detailed description of the characteristics of the group and each participant as an individual. Many discrepancies between studies can often be attributed to the fact that researchers were working with samples that were not equivalent (Warren, 1984). The second step consists of identifying the correlates and the reason and cause(s) for the variation. The individual differences approach combines the logic of the case study technique with the advantages of quantitative methods.

There are several difficulties associated with this approach and these are mainly related to vast array of factors (physical, clinical and environmental) that even if identified can have a different effect on each participant. However, it is exactly this complexity that should interest researchers. Good research is the one that not only identifies the statistical significance of an effect but also the magnitude and reasons that can explain it. Explaining the difference is what will aid professionals in the design of intervening programs that are catered to the group or the specific individual.


How does this relate to null hypothesis testing?

In the final chapter of his seminal book Blindness and early childhood development David Warren (1984) expresses his disappointment about the quality of past research. This dissatisfaction stems mainly from methodological and analytical weaknesses that fail to account for the heterogeneity of the population. Researchers often overlook the need for detailed descriptions of the various characteristics of the population. In fact, the attention that should be ascribed to these descriptive techniques is usually forfeited in exchange for statistical significance testing that more often that cannot provide any explanation regarding the presence of an effect. Perhaps the most obvious reason behind the ineffectiveness of NHST is the fact that the tests most commonly used (Student’s t-test and Analysis of variance) rely on group averages (mean) and are based on the assumption of a normal distribution. An analysis solely based on group means is unrealistic and short sighted. Researchers studying visual impairment and blindness cannot afford to “indulge in the luxury” of studying only group means and disregard any variations from it (Warren, 1984, p. 298). A certain amount of variability will always exist and some reasons can almost certainly be traced to determinant factors. It is the duty of the researcher to record and report these characteristics and make the necessary efforts to explain the presence/absence of an effect not only for the group but for subgroups or specific subjects that do not follow the trend.

The history of psychology is filled with examples of renowned researchers (Piaget, Vygotski) that have managed to reach important conclusions without relying on significance testing. Unfortunately, many are still under the illusion that results accompanied by significant probabilities values (p values) are more robust and a fundamental requirement for publication. As we shall see, the null hypothesis is always false and rejecting it is only a matter of securing a large enough sample. In addition, results that are not statistically significant should also be considered and reported. Not finding an effect (or a difference) can provide relevant information about the reliability and adequacy of the chosen methods and can lead to a reassessment of the entire experimental design. Results that fall short of statistical significance will also force the researcher to consider the other array of “self selected” or “status” variables that are brought by each individual participant and are beyond the control of the experimenter.

We are now faced with an important and yet somewhat paradoxical question. If the need to change from a comparative (or at least include) to an individual differences approach was identified in the early 80’s why have so many researchers failed to incorporate this in their research design? Why after having identified serious problems with NHST do researchers continue to rely exclusively on statistical significance to explain their results?


The problems with NHST

The problems associated with NHST are not new. In fact they have been around for so long that one cannot help but feel ashamed that for past two decades a considerable amount of research has been conducted (hypotheses have been tested) under such an inadequate and insufficient system. A recent article on the Economist (January 2004) criticizes the over reliance on statistical significance testing rather than logical reasoning on the part of social scientists. It denounces the misuse of statistical data and argues that more often than not researchers do a lousy job when manipulating and making sense of numbers. The wide availability of computers and the ease of use of several sophisticated statistical packages have fuelled a bogus statistical revolution whose main order is to test for significance. Statistics can be deceptive especially when they are used to explain human behaviour. Significance testing does not tell us whether differences actually matter or provide any explanations. The researcher’s dependency on significance testing has lead to variety of problems especially when these have failed to separate statistical significance from plausible explanation.

Despite years of ferocious criticism and recent guidelines published by the American Psychological Association (APA) many researchers in geography and psychology continue to use NHST to interpret and explain their results. Perhaps the biggest problem stems form the fact that there is lack of comprehension regarding the concept of statistical significance. Results from significance tests can be somewhat deceptive at times giving the illusion of objectivity and it is important that researchers understand the purpose and implications of these tests before applying them. Cohen (1994) points to three common mistakes frequently made by researchers: 1-The misinterpretation of p as the probability that the null hypothesis is false. 2-That when we reject the null hypothesis p is the probability of successful replication. 3-That rejecting the null hypothesis affirms the theory that led to the test. More recently, Kline (2004) has outlined several false conclusions that derive from these misinterpretations. These authors among several others (Chatfield, 1985; Schmidt, 1996; Smith & Prentice, 1996) have put forward a variety of methods such effect size measures, confidence intervals, point estimates that combined with graphical tools that can be used as a replacement or complement to NHST. Before we can review these methods and critiques we must first clarify the purpose of NHST. What does the p value really tells us? And what can we conclude when a result is said to be statistically significant and we can reject the null hypothesis.

NHST indicates the probability (p) of data (or more extreme data) given the null hypothesis is true. The p value is a probability statement. It is the measured probability of a difference occurring by chance given that the null hypothesis is actually true. In other words it measures the strength of evidence for either accepting or rejecting the null hypothesis. A small p value suggests that the null hypothesis is unlikely to be true. It does not tell us the probability that the null hypothesis is false. Clearly these are two different things. However, much research has been conducted under the illusion that the level of significance in which the null hypothesis is rejected (usually .05) is the probability of its veracity (Cohen, 1994). The verity of the null hypothesis can only be ascertained through Bayesian or other type of statistics where the probability is relative to the degree of belief and not frequency (Cohen, 1990).


The six fallacies

As Cohen (1990) has impeccably noted, what researchers would like to know is how likely there are differences in the population given the data. Unfortunately all that NHST can provide is information on how likely is the data, given the assumption that there are no differences in the population. The list below is an adapted version of Kline’s (2004) review of the typical false conclusions adopted by researchers who misinterpret the meaning of the value of p in NHST:

Magnitude fallacy: This is the false belief that the p value is a numerical index of the magnitude of an effect (strength of the relationship). That is, the lower the p value the larger the effect. Psychology and geography journals are filled with examples that deliberately regard a difference at (.001) level as more important than one at the (.05). These are wrong interpretations given that the p value only indicates the conditional probability of the data given that the null hypothesis is true. Significance levels are highly dependent on sample sizes to the point that “highly significant differences in large sample studies may be smaller than even non-significant differences in small sample studies” (Schmidt, 1996, p. 125). Increasing the sample size will almost always lead to results that are statistically significant. As we shall see, the effect size is what tells us about the magnitude of an effect - strength of the relationship between the independent and dependent variables.

Meaningfulness/causality fallacies: The false belief that rejecting the null hypothesis automatically asserts the truth (proves) of the alternative hypothesis. Rejecting the null hypothesis does not imply a causal relation. The alternative hypothesis is only one of many possible hypotheses and rejecting the null hypothesis does not confer exclusivity to a specific theory. There are may be a variety of possible intervening and yet to be identified factors not covered by the alternative hypothesis. Replication is perhaps the best evidence.

Failure/quality fallacies:
The wrong conclusion that if you do not reach significance at least at the (.05) level (if the null hypothesis is not rejected) than the study is a failure. In other words, reaching significance is what dictates the quality of the study. Type II errors can occur when statistical power is low or the overall research design and methods are inaccurate. Failure to reject the null hypothesis can be an important part of the research. It forces the researcher to look for the reasons behind this lack of difference/significance and allows for a critique of the actual data and methods. In some cases, failure to reject the null hypothesis along with a well-sustained explanation of the data will raise questions about the validity of past research.

Sanctification fallacy: This is related to the failure/quality fallacies and deals with the fact that many researchers credit a finding as significant if it falls between the sanctified (.05) and (.01) level but consider the difference or relation insignificant if the value of p is larger, even if only marginally larger. As Rosenthal (1989) pointed distinctions should not be so black and white as “surely, God loves the .06 nearly as much as the .05”. The purpose of good research is not make mechanical “yes and no” decisions along a sanctified significance level but to formulate clear and well backed theories whose verity will depend on successive replication. It is not a question whether the difference is significant but whether it is interesting.

Equivalence fallacy: This is the belief that failure to reject the null hypothesis automatically means that the population effect is zero and that the two populations are equivalent. Again, this is similar to the meaningfulness fallacy and as Kline (2004) notes "one of the basic tenets of science is that the absence of evidence is not evidence of absence". If the null hypothesis is not rejected nothing should be automatically concluded. The symmetrical relation “if it is not significant, it is zero” is erroneous.

Replication fallacy: Rejecting the null hypothesis does not allow us to infer anything on the probability that another study which replicates the research will also end up rejecting the null hypothesis.


Effect size

Kirk (1996) argues that NHST is a trivial exercise given that rejecting the null hypothesis is only a matter of having a large enough sample. The Fisherian null hypothesis scheme does not consider the magnitude of effect – the size of the difference. The value of p only indicates the probability of an effect occurring by chance. When we have enough evidence to reject the null hypothesis we can only identify the direction of an effect (A > B or A < >[Effect size = mean of experimental group] – [mean of control group] / standard deviation


In situations where the control and experimental groups cannot be distinguished it is up to the researcher to decide which standard deviation to use as long as it is reported. A solution is to use the average of the standard deviation of the two groups. Hedge’s g is the ratio of the mean difference divided by the pooled standard deviation and allows for a correction of biases due to unequal and small sample sizes.

Effect size indicators have existed since the early 30’s but have been for the most part ignored by researchers in the social sciences. As noted by Denis (2004) a survey of articles in the British Journal of Psychology and the British Journal of Social Psychology revealed that not a single article published between 1969 and 1972 ever discussed effect sizes. More shocking is the fact that when effect sizes were calculated these tended to be very low for the majority of cases. Nowadays, this blatant disregard to what seems to be an essential part of the research design and almost a necessity for understanding results has finally caught the eye of the American Psychological Association. The APA now asks for researchers to report effect sizes when presenting their results. There is an abundance of software that will automatically calculate effect sizes and there should be no excuses for researcher not to report it.


Interpreting effect sizes

There are different ways to interpret effect sizes. The table below is an adapted version of Coe (2000). For a more in depth discussion on the interpretation of effect size please refer to:

http://www.cemcentre.org/ebeuk/research/effectsize/interpret.htm


Table 1. Effect size – Interpretation


Effect sizes can be converted into statements about the overlap between two groups. This can be a valuable tool when discussing the magnitude of the difference between groups. The first column in the table presents the actual effect size. The second presents the probability of guessing which group a person belongs on the basis of their performance on a specific task. If the effect size is zero than the probability of a correct guess is fifty percent. As the effect size increases, the overlap decreases and the chances of correctly identifying the group increases.

Cohen (1990; 1994) has written substantially on effect sizes and provides some guidelines for their interpretation based on the effect size of differences that are familiar. Cohen’s d is a measure of the distance between means (Denis, 2003). As noted in the table above an effect size of 0.2 is considered small and can be compared to the difference between the heights of fifteen and sixteen year old girls. An effect size of 0.5 is regarded as medium and compared to the difference in heights between fourteen and eighteen year old girls. Finally, an effect size of 0.8 is considered large and Cohen equates it to the difference in heights between thirteen and eighteen year old girls. As mentioned above effect sizes can also be reported using Hedge’s g. This is the ratio of the difference between two means divided by the combined estimate of the standard deviation.

There are no exact guidelines as to what indicates a small or large effect. Researchers should be encouraged to report both the probability value and the effect size. Reporting both values will prevent the researcher from falling in the trap of reaching significance but not knowing the strength of the relationship (magnitude of difference). Here it is important to note that effect sizes are descriptive and not inferential. They are descriptive of the sample data and offer no information on the degree of association for the rest of the population. In addition, effect sizes should be interpreted with particular care, as they are highly dependent on the situation. It is up to the investigator to become acquainted with different characteristics of the data and develop and understanding of what constitutes a small or large effect. This last recommendation should not be taken lightly especially in the behavioural sciences where a small effect can have very important implications.


Statistical significance vs. clinical significance

Effect sizes can provide information about the practical (clinical) significance of an effect. An effect can be statistically significant and mathematically real but too small to be important. For this reason it is important to differentiate between statistical and practical significance. As mentioned above, statistical significance does not provide any information about the size of an effect and is susceptible to differences in sample sizes. Trivial differences can have very low p values if the size of the sample is large enough. Practical significance is a deductive statement (judgement) about the utility of a result. It will depend on the researcher’s understanding of the situation, practical knowledge and experience. Moreover, the magnitude of an effect should not be interpreted as synonymous with practical significance. It is possible to have a small effect size that is of high practical importance and vice-versa.


Confidence intervals

Relying on information from samples of a population will always lead to some level of uncertainty. The confidence interval quantifies this uncertainty. It is a range of values within which the population parameter is likely to be included. This is calculated from the sample data and usually reported at the 95% level. In this manner, the confidence interval for the difference between to means is a range of values where the difference between the means of two populations may lie. The width of a confidence interval can provide some information about how certain we are about the difference in means. In general, the narrower the confidence interval the higher is the precision of the estimate. The confidence interval will tend to be wide when the sample size is small and the scores are less homogeneous

Confidence intervals are a useful tool for the interpretation of results and an appealing alternative to NHST given that they can also provide information as to whether the difference between two means is statistically significant. When looking at the confidence interval of a difference one can easily check whether the interval includes a value that implies “no effect”. If not stated a priori this value is usually assumed to be zero (null hypothesis).

Simon (2006) provides several graphical examples as to how researcher can use confidence intervals to interpret their results. Figure 1a is an example of a confidence interval that includes the null value. In his case, the mean difference is not statistically significant. Figure 1b is an example of statistically significant difference where the null value falls outside the limits of the confidence interval. Confidence intervals also allow the researcher to interpret whether a difference is clinically significant. As mentioned above a difference can be statistically significant but of no practical value if falls within the range of clinical indifference. Figure 1c illustrates a situation in which the confidence interval includes the null value and these fall within the range of clinical indifference. Here the mean difference is neither statistically or clinically significant. In figure 1d the mean difference is statistically significant but of no clinical value given that the range of clinical indifference covers the totality of the confidence interval. Finally, figure 1e is an example of statistically and clinically significant difference where the null value lies outside the confidence interval and these lie outside the range of clinical indifference.


Figure 1 – Confidence interval and null hypothesis


Adapted from: Steve Simon's Statisitical evidence in medical trials (pages 142-143).


Graphic representation and the initial examination of data


More effort should be put during the initial examination of data. Before engaging in statistical tests, researchers need to clarify the general structure and quality of the collected data and check for consistency, credibility and completeness (Chatfield, 1985). This can easily be achieved through descriptive statistics and graphical techniques but must also be complemented by the researcher’s experience during the data collection period. This type of data management will allow the researcher to consider not only the original hypotheses but an array of new and unlikely possibilities. Wainer & Thissen (1993) put forward some benefits of displaying data graphically:

1. Descriptive capacity: variety of description that can be simultaneously grasped
2. Versatility: Illustrate aspects of the data that were not expected
3. Data orientation: Trends and the characteristic distribution of the data
4. Potential for internal comparisons: Allows for quick comparisons within and between different data sets
5. Summary of large data: Graphs are particularly useful for summarizing large data sets

Descriptive statistics can prevent a variety of errors associated with the type of the distribution of the data. The mean can be an efficient estimate of central tendency if the population distribution is normal. However, even a slight variation in the distribution can have a large effect on the mean. In situations where the distribution is not normal, the median is a more robust measure (Smith & Prentice, 1993). Stem and leaf displays are a quick and effective way to present the shape of the distribution from particular data and check for outliers. They can also present important information about order statistics.

The “five number” summary of a data set consist of the minimum, the maximum, lower quartile, the median, the upper quartile and the maximum. It is essential for the researcher to know and report these values along with the standard deviations. A box plot is a visual display of the “five number” summary. They are particularly useful when viewed side by side and used to compare data from different groups (Tukey, 1977). The median is the line that runs across the box. The box itself stretches from the lower hinge (25th percentile) to the upper hinge (75th percentile). The lines that stretch out of the box are known as whiskers and they indicate the minimum and maximum data values. Points located beyond the whiskers (on either side) are the outliers. If the median line is not equidistant from both hinges the distribution is skewed. In a positive (right) skewed distribution the mean is larger than the median. In a negative (left) skewed distribution the mean is smaller than the median.

A good knowledge about the characteristics of a distribution can also inform the researcher about the value of the test conducted. A linear regression examines the relationship (or degree of fit) between two ordered variables. A scatter plot is usually constructed in order to visualise the data. This will allow the researcher to determine the appropriateness of the linear model and detect any departure from linearity (Smith & Prentice, 1993). In a least square regression a line is plotted where the sum of the squared distance of the points is a minimum. However, in a least square regression (the most commonly used method) an outlier can have a strong impact in the final result of the regression.

The median-to-median line (or resistant line) is a line through the data that is least affected by outliers and is an attractive alternative to the least square regression. In the resistance line technique no single point on the sample has a special influence on the projection of the line. Details for the calculation of resistant lines can be found in Velleman & Hoaglin (1981). Finally, there are several diagnostic tools for the evaluation of the adequacy of regression models (leverage, Cook’s distance, residual) and these are included in most statistical packages. Reporting Cook’s distance is particularly useful as it provides an index of the actual influence of each case on the regression function.

Sunday, February 12, 2006

The three classics

Past research has compared the development of children with visual impairment to that of sighted children of the same chronological age. Early research found that in the absence of disabilities children with visual impairment or blindness generally follow the same developmental sequence as sighted children. However, although these children reach the same developmental bench marks they tend to do so at a slower rate even if provided with the correct support and training (Ferrell, 2003).

We shall now look at three classic studies, significantly sited in current research, that have used this comparative approach.

Norris et al., (1957):


Longitudinal study between 1945 and 1952 that sought to establish developmental norms for children with visual impairments. The sample consisted of 295 children sixty of which were studied intensively under supervision of psychologists, social workers and the project staff. All the children had no additional handicaps aside from blindness although 85% were premature babies which subsequently developed retrolantal fibraplosia (current name: as retinopathy of prematurity - ROP). Intelligence, sensorimotor and social development were assessed with the Cattell Infant Intelligence Scale, the Interim Hayes-Binet Intelligence Test, the Kuhlman Scale of Intelligence and an adapted version of the Vineland Social Maturity Scale (Ashcroft, 1959). The researchers also gathered information on the level of mobility, medical factors, and created a prognostic rating scale to estimate the child’s potential for optimal development and future functioning (Warren, 1994). Finally, a rating scale was created to assess the influence of environmental characteristics and the child’s opportunities for learning. That is, the impact of the family and environment on the development of the child’s motivation and independence. The scale measured the family’s capacity to meet the child’s basic needs (especially those related to their visual impairment), family stability and their reaction to their child’s condition.

Results from the Cattel Infant Intelligence Scale revealed that the blind children took longer to achieve certain developmental milestones particularly motor skills (fine & gross), perception and perceptual motor integration. (Ferell, 1986). Lack of vision was also found to limit awareness of space and spatial relationships (Chess & Gordon, 1984). Fraiberg (1977) notes that only 50% of the blind children from the Norris et al., intense group were independent walkers at twenty-four months. This is a considerable lag if compared to sighted children who typically begin walking in their first year. A delay was also observed in the awareness of object permanence.

According to Warren (1994) one should be careful when interpreting these results given that no age correction for prematurity was used to control for the ROP subjects. He argues that if a three month correction factor is applied most motor and locomotor tasks fall within the age appropriate norm. The same is true for language development where the blind children showed a developmental lag when compared to the Catell norms but these differences diminish if a correction for prematurity is applied.

Several conclusions can be derived from this study. There was no significant correlation between degree of functional vision and any of the other measures except level of mobility. Overall, the development of the children in the “intensive” group was approximately equal to that of the sighted control. More important however, was the fact that “favourable opportunities” for learning were seen as the fundamental determinant of the child’s functioning level. Opportunities for learning can be understood as the stimulation necessary to elicit appropriate development. Providing the right environment and education at the appropriate time was more important than the degree of blindness, measured intelligence or the socioeconomic status and education background. The authors also suggest a “geometrical effect” to explain developmental delays. That is, the achievement of developmental milestones (or the skills that categorizes this milestone) is related to the time the child is ready to learn and when the opportunity to learn is provided. The authors conclude there was no relation between brain defect and ROP and that no specific mental deficiency could be directly attributed to blindness. The study is also one of the first to report that there was a considerable range of individual differences. That is, some of the children in the intensive group were on par (or sometimes advanced) with sighted developmental norms while others were not.

There are however a few methodological problems associated with this research. As noted above the subjects were chosen on the basis of no additional handicaps. This allowed the researchers to conclude that on the absence of mental or neurological deficiencies individual differences can be related to contrasting environmental circumstances. In a series of subsequent evaluations (Cohen et al., 1961; Cohen et al., 1964; Cohen et al., 1966) it was found that many of the participating children revealed patterns of neurological abnormalities.* The studies also revealed significant differences in intelligence scores. The authors have also been criticised for an uneven population where approximately two-thirds were females and the fact that the pre-testing level of intelligence for children in “intense group” was considerably higher than those in the control group. Finally, results should be carefully considered given the prematurity factor of the individuals blinded from ROP even with the proposed age corrections.

*One should be cautious when associating the concept of abnormal brain activity and brain damage especially when comparing a visually impaired population to a sighted control. Differences in brain activity (electroencephalogram and the attenuation or absence of alpha activity) are expected in situations of restricted sensory input.


Maxfield & Fjeld (1942) and Maxfield & Buchholz (1957):

Researchers have a used a variety of standardized scales to measure social development and adjustment of children with visual impairments. These are diagnostic tools but can also provide important information on the developmental norms of this population.

The Vineland Social Maturity Scale (Doll, 1930) was designed as an indicator of social competence, self help skills and adaptive behaviour for sighted children from infancy to adulthood. The scale consists of 117 items divided in the following categories: daily living skills (general self-help, eating, dressing); communication (listening, speaking, writing); motor skills (fine, gross & locomotion); socialization (interpersonal relationships, play, leisure and coping skills); occupational skills and self direction.

Maxfield and Fjeld (1942) adapted the Vineland scale for children with visual impairments. This became known as the Maxfield-Fjeld (MF) scale. The adapted version allowed for comparisons with norms for sighted children and to uncover specific areas in which the visually impaired are developmentally delayed. The scale avoided the measurement of intelligence, personality, habits, skill and focused instead “on the composite capitalization of such abilities for socially significant behaviour” (Maxfield & Fjeld, 1955, p. 2).

It is important to differentiate between intelligence (IQ) and social maturity tests. Warren (1984) notes that intelligence tests are designed to assess intellectual potential while the social quotient (SQ) in the social maturity scale is representative of actual performance rather than potential. This is of particular relevance in this research given that it will be argued that performance in spatial tasks is an indicator of present competence not ability or “capacity to do”. Several researchers (see Warren, 1984 p.226) found significant correlations between the two measures.

The MF scale consisted of 77 items classified under several categories (general, eating, dressing, locomotion, occupation, communication, self-direction and socialisation). Scores are presented in the form of a social quotient (social age/chronological age x 100). The children in their study ranged from nine months to seven years and varied in terms of mental ability (3 categories: superior, normal & retarded) and functional vision (total to minimal).

Maxfield & Buchholz (1957) revised the MF scale and applied to 484 children that varied in functional vision their age ranging from five months to six years. It should be noted that like the Norris et al., (1957) study the majority of these children (60%) were blind due to ROP . The majority of the remaining children suffered from cataracts or optic atrophy. The study’s main aim was to inventory the social development of children with visual impairment based on the general performance of other visually impaired children of the same chronological age (Ferrell, 1986). That is, a social maturity scale normed on blind children.

Several results emerged from this research. First, it was found that the social quotient of the blind and visually impaired children (as a group) was considerably lower (mean VI = 83.54; mean sighted = 100). It should be noted however, that there was a great deal of variation within the visually impaired group with SQ scores ranging from 26 to 163 with a standard deviation of ± 29.28. In addition, the authors did not find any significant differences in the development of locomotion when compared to the sighted children. This results differs from Norris et al., (1957) who found considerable lags in crawling and walking.

Maxfield and Fjeld also compared SQ scores of the total blind with those of the visually impaired. They found only marginal differences between these groups with the visually impaired scoring higher. Here again they note that the “difference is not statistically reliable since the groups are small and the variability [is] great” (Maxfield & Fjled, 1942, p. 12). The authors conclude that the blind tended to be more docile, lack initiative, are less active and introverted.

Closer analysis revealed that health, early intervention, specialized training and environmental stimulation were among the most important factors leading to a higher a SQ in the blind and visually impaired children. Specialized training is of particular importance an this was obvious from a rise in the SQ of during the testing phase. They conclude that if the visually impaired is stimulated to take an interest in the environment a desire to dominate it will develop in much the same manner as the seeing child.

Finally, the authors are quick to point that given the complexity of the problem, it is doubtful that any single diagnostic instrument is sufficiently adequate to measure the development of the visually impaired. The scale should be used as a guide and not as an absolute measure. The same amount of caution should be used with the age norms given the size of the sample and the amount of diversity among the children.


Fraiberg (1977):

Fraiberg studied the development of ten congenitally blind babies some of which had minimal light perception. This was a 15 year longitudinal study tied with an educational program summarized in her book Insights from the Blind (1977). The babies entered her educational program from ages one to eleven months and were neurologically intact with no additional sensory or motor disabilities. The purity of the sample allowed for inferences to be made about the role of vision in the development and organization of sensory abilities. An in depth review of her work is beyond the scope of this thesis. However, we shall outline some of her major findings in the area of prehension and gross motor development and their implication for a developmental theory of the blind.

In the area of object prehension, she observed that prior to entering the educational program 7 out 10 of her subjects made no “gestures of reach for persons or toys at tactile remove even when voice or sound cues [were provided]” (Fraiberg, 1977, p. 275). In her educational program she argues that vision usually lures the child to discoveries and she encourgaes parents to create exchanges and experience to arouse interest and maximally engage the child with the environment. She notes however, that despite the program’s effort, the blind infants were still developmentally delayed. She attributes this lag to the difficulty the blind infant has with the concept of object substantiality and spatial unity.

In the area of gross motor development she notes that typically the postural attainment of the blind infant were within the norms of the sighted. However, the consequent mobility items (that follow each postural attainment) were considerably delayed falling outside the sighted ranges. Here again, she argues that blindness acts as an impediment to adaptation that restricts “environmental lures” that would initiate locomotor development. Fraiberg regarded the development of an object concept as critical. It is only after the attainment of the concept of object permanence (constancy) that the child is able to confidently let go of the object (or person) and explore the rest of the environment (Warren, 1984). In addition, the absence of stimulation is also associated with a delayed formation of a sense of security and the retardation exploratory behaviour (Warren, 1984).

Her educational program urged for an enhancement of the ties between parents and children and warns of the retarding effects of parental over-protectiveness. Fraiberg puts forward several reasons why her findings should not be generalized to the blind population. She notes that the “blind” population encompasses individuals with a varying amount of useful vision. This is coupled with a high incidence of brain damage and other associated handicaps. Furthermore, the age of onset impairment should also be considered given that many blind individuals have lost their vision after crucial developmental stages.